30 March 2017
South African Rand
A study of the recent strength of the South African Rand
Recently someone was interested in moving a portion of money out of South Africa to Australia. Some news came out about the South African President, Jacob Zuma firing the respected economy minister. The Rand slipped quite a bit, the individual was concerned that they should have moved the funds out, so I performed an analysis of the Rands strength to validate if it was a good reason to sell, specifically now.
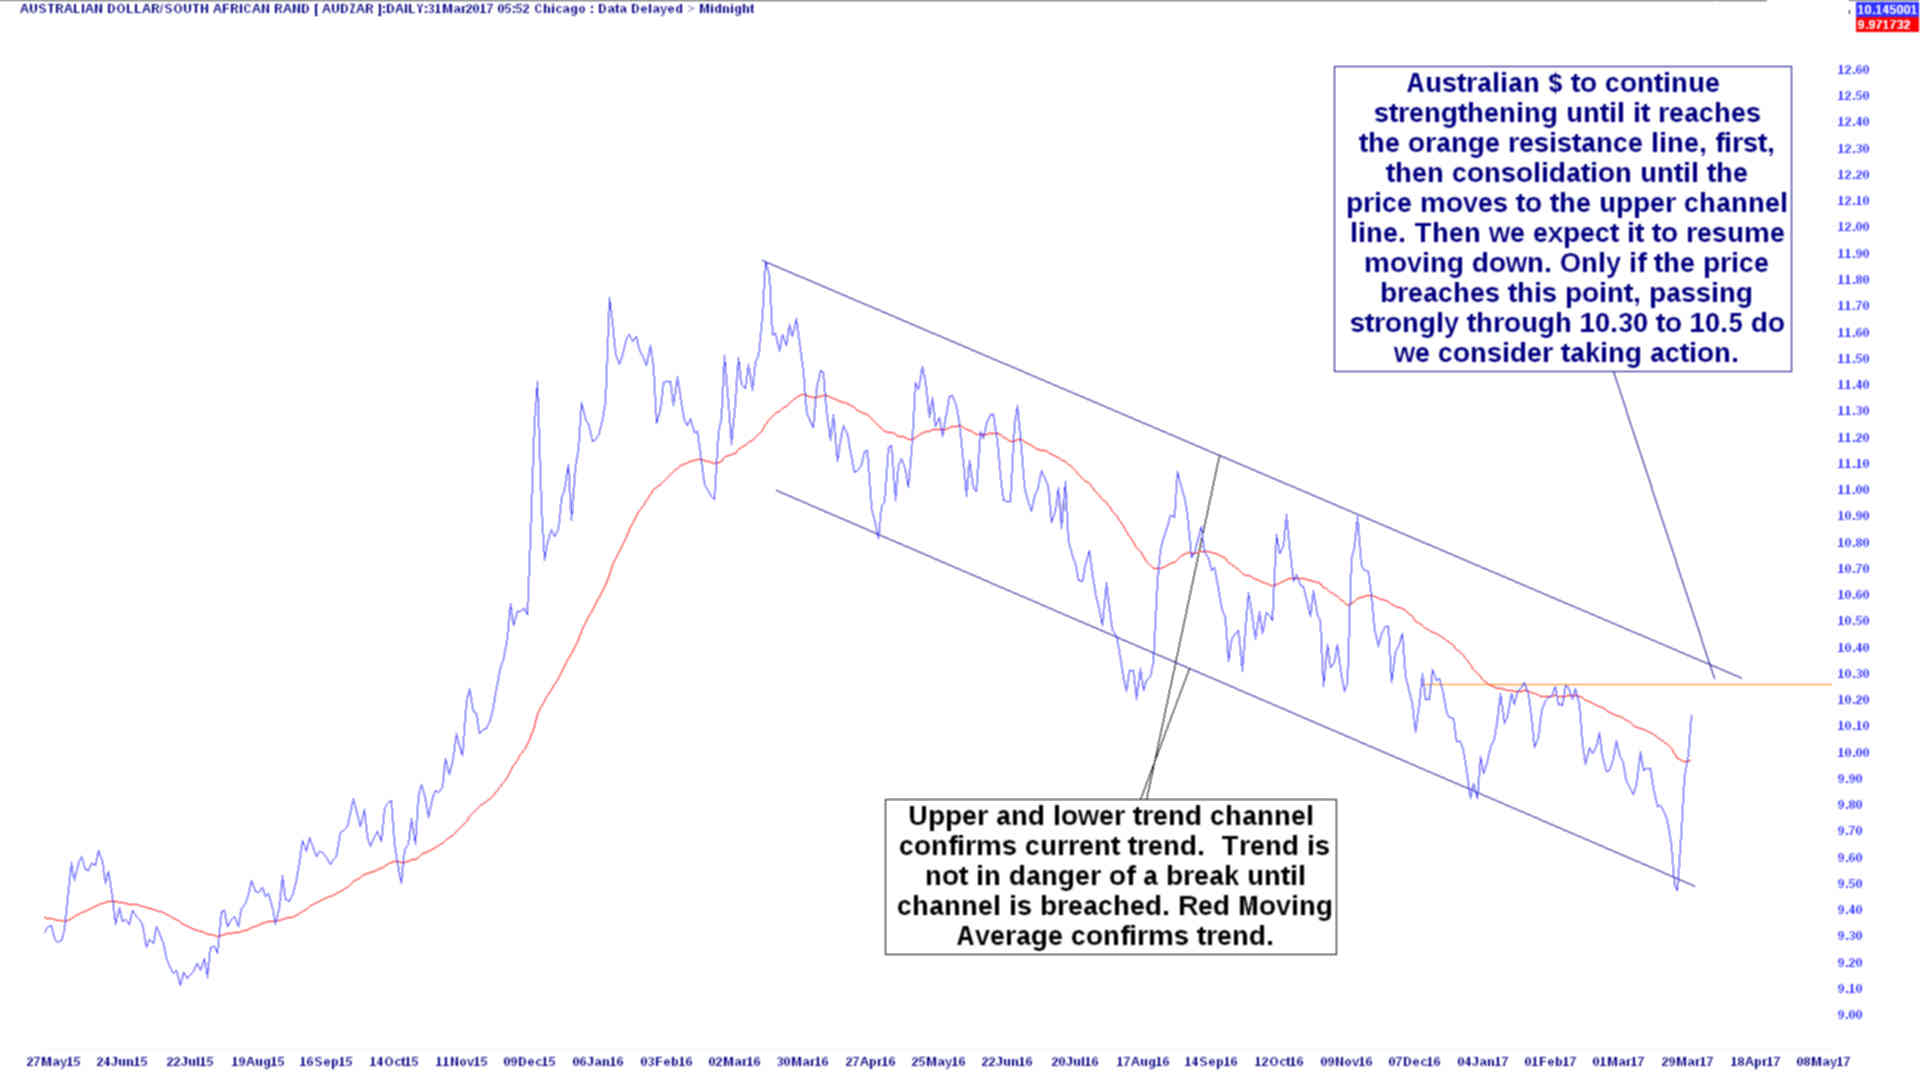
Daily ZAR vs AUD
New trend channel has formed, indicating strength
This is a daily graph below of the AUD vs ZAR. It shows the trend that started around March 2016 of ZAR strength. The channel lines form an envelope trend. There have been at least 3 or 4 sharp moves like the recent ones, nothing to be concerned about. As one can see, I expect it to hit about R10.30 and then to start reversing (or at least hang there a bit, then reverse). From this chart we can expect the trend to continue as long as this resistance stays in tact. If the trend continues or re-establishes, then I project the ZAR to hit R8.5 to the AUD by year end.
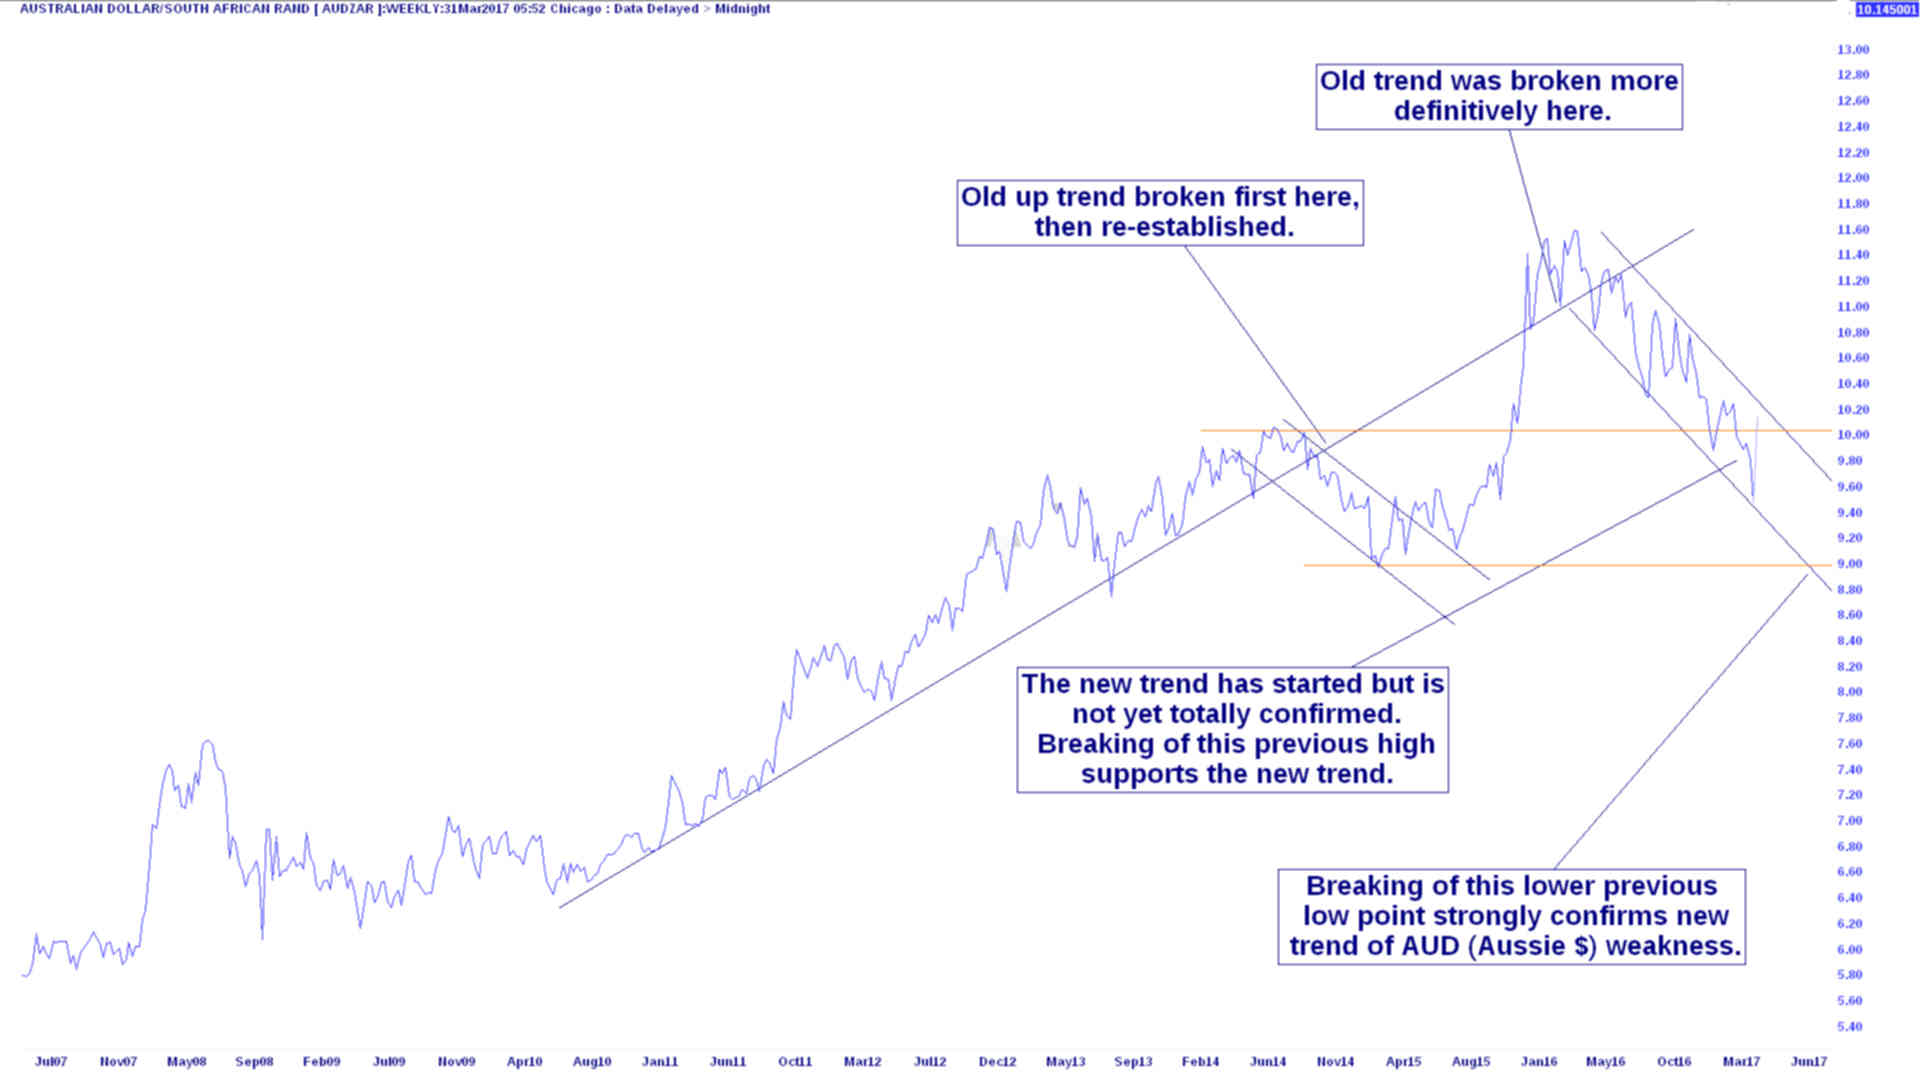
Weekly ZAR vs AUD
The longer term view
The weekly study also enhances the long term trend. It also shows where the long term trend was previously broken but re-established. Even on the reversal of the first weakening trend, there was plenty of time to pick up or sell the currency at a better price. The charts also suggest R9.00 a good price if one needed to send money towards the end of the year, but if one can wait longer then a potentially lower price might make itself present, depending on confirmations.
12 April 2017
South African Rand versus the American and Australian Dollar
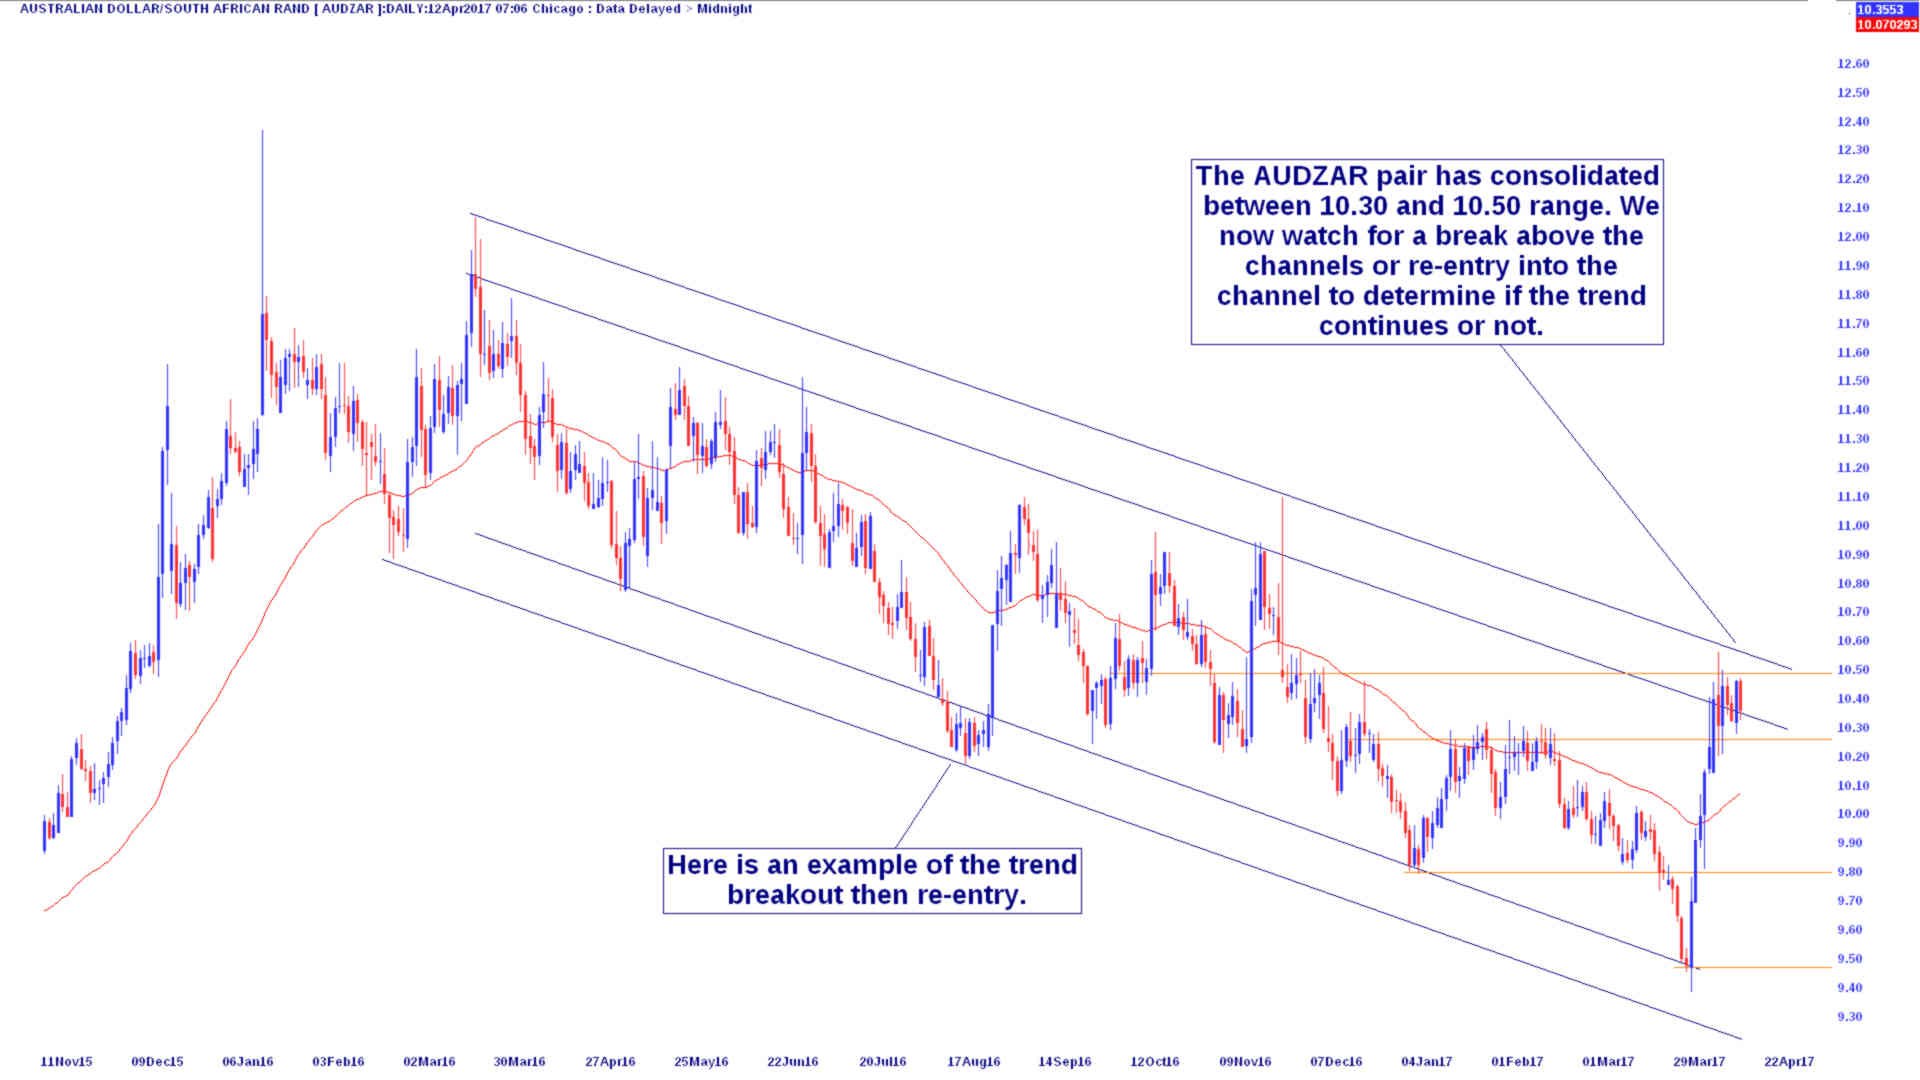
The Rand continued to fall and consolidated between the R10.30 to R10.50 range to the Australian dollar. The chart reflects the deciding point where the currency pair consolidate and a breakout into a confirmatory new trend could occur.
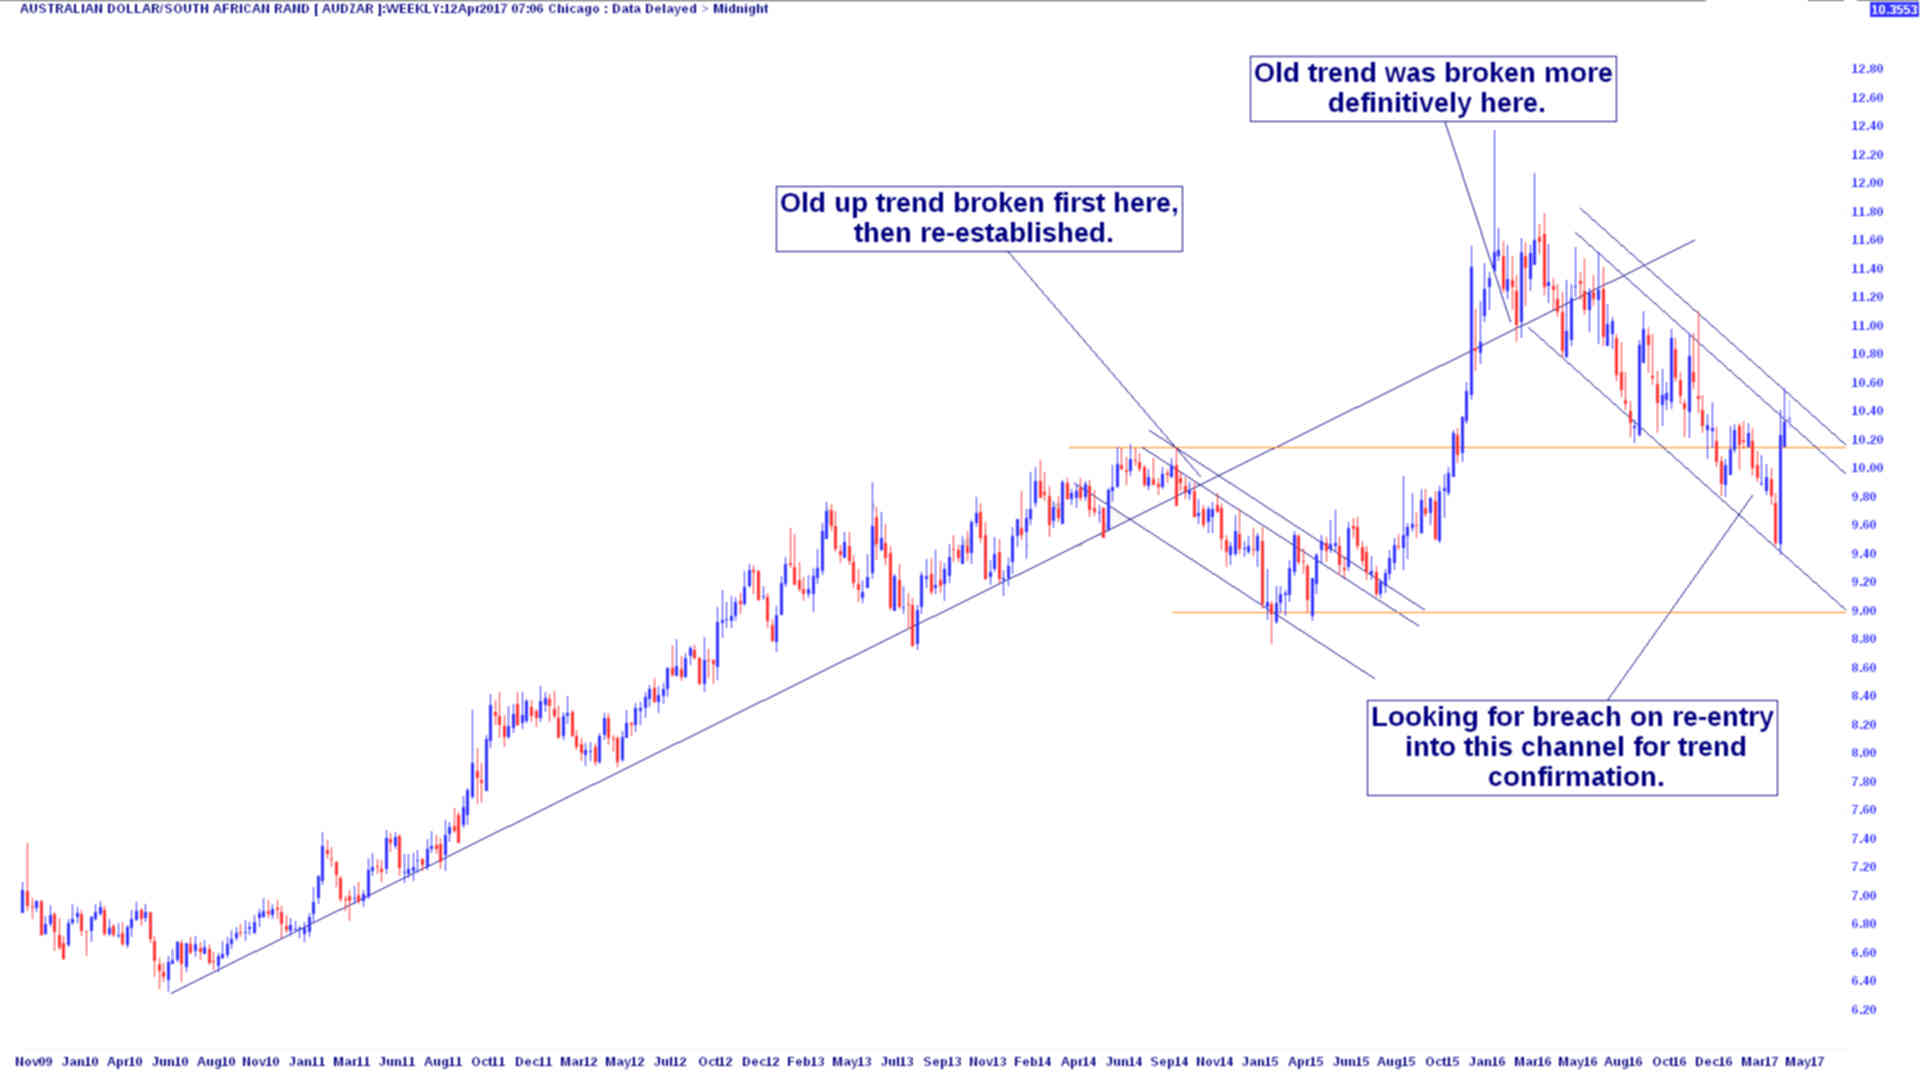
The weekly graph below also reflects this in the perspective of the longer term trends. Again we are watching for defining moments in whether the price continues in the original direction or starts a new weakening Rand trend.
Looking at the Rand from a wider perspective
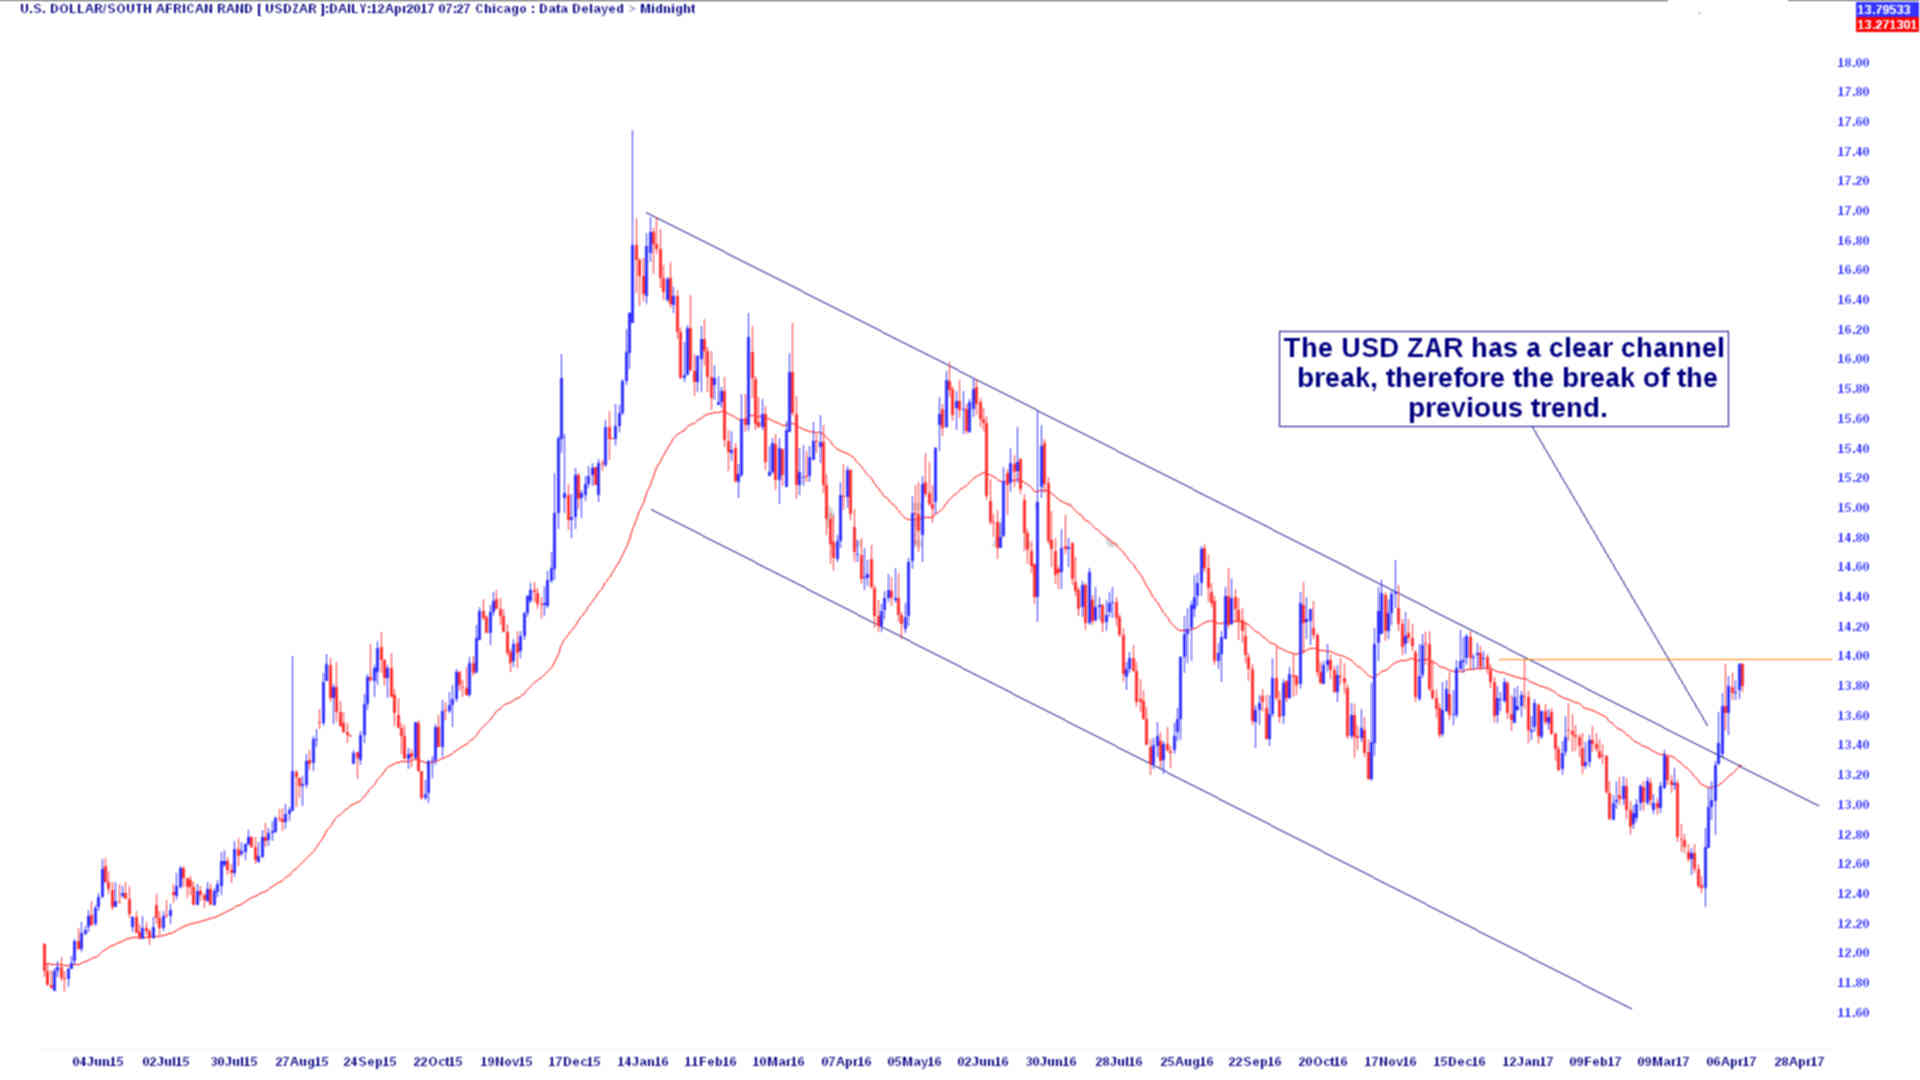
The US Dollar versus the South African Rand
To get a better idea of the true or underlying performance of the South African Rand, it is worthwhile reading the ZAR versus the USD. Below is the daily chart of the USD vs ZAR. Here you can see a much cleaner trend that has formed in a clear channel. The Rand strengthened and kept to clear boundaries within the two channel lines, however here the break of the trend above R13.00 towards R14.00 looks much more definite. This seems to indicate the early breakdown of the strengthening of the Rand. There seems to be some intermediate resistance to Dollar strength presented by the orange resistance line.
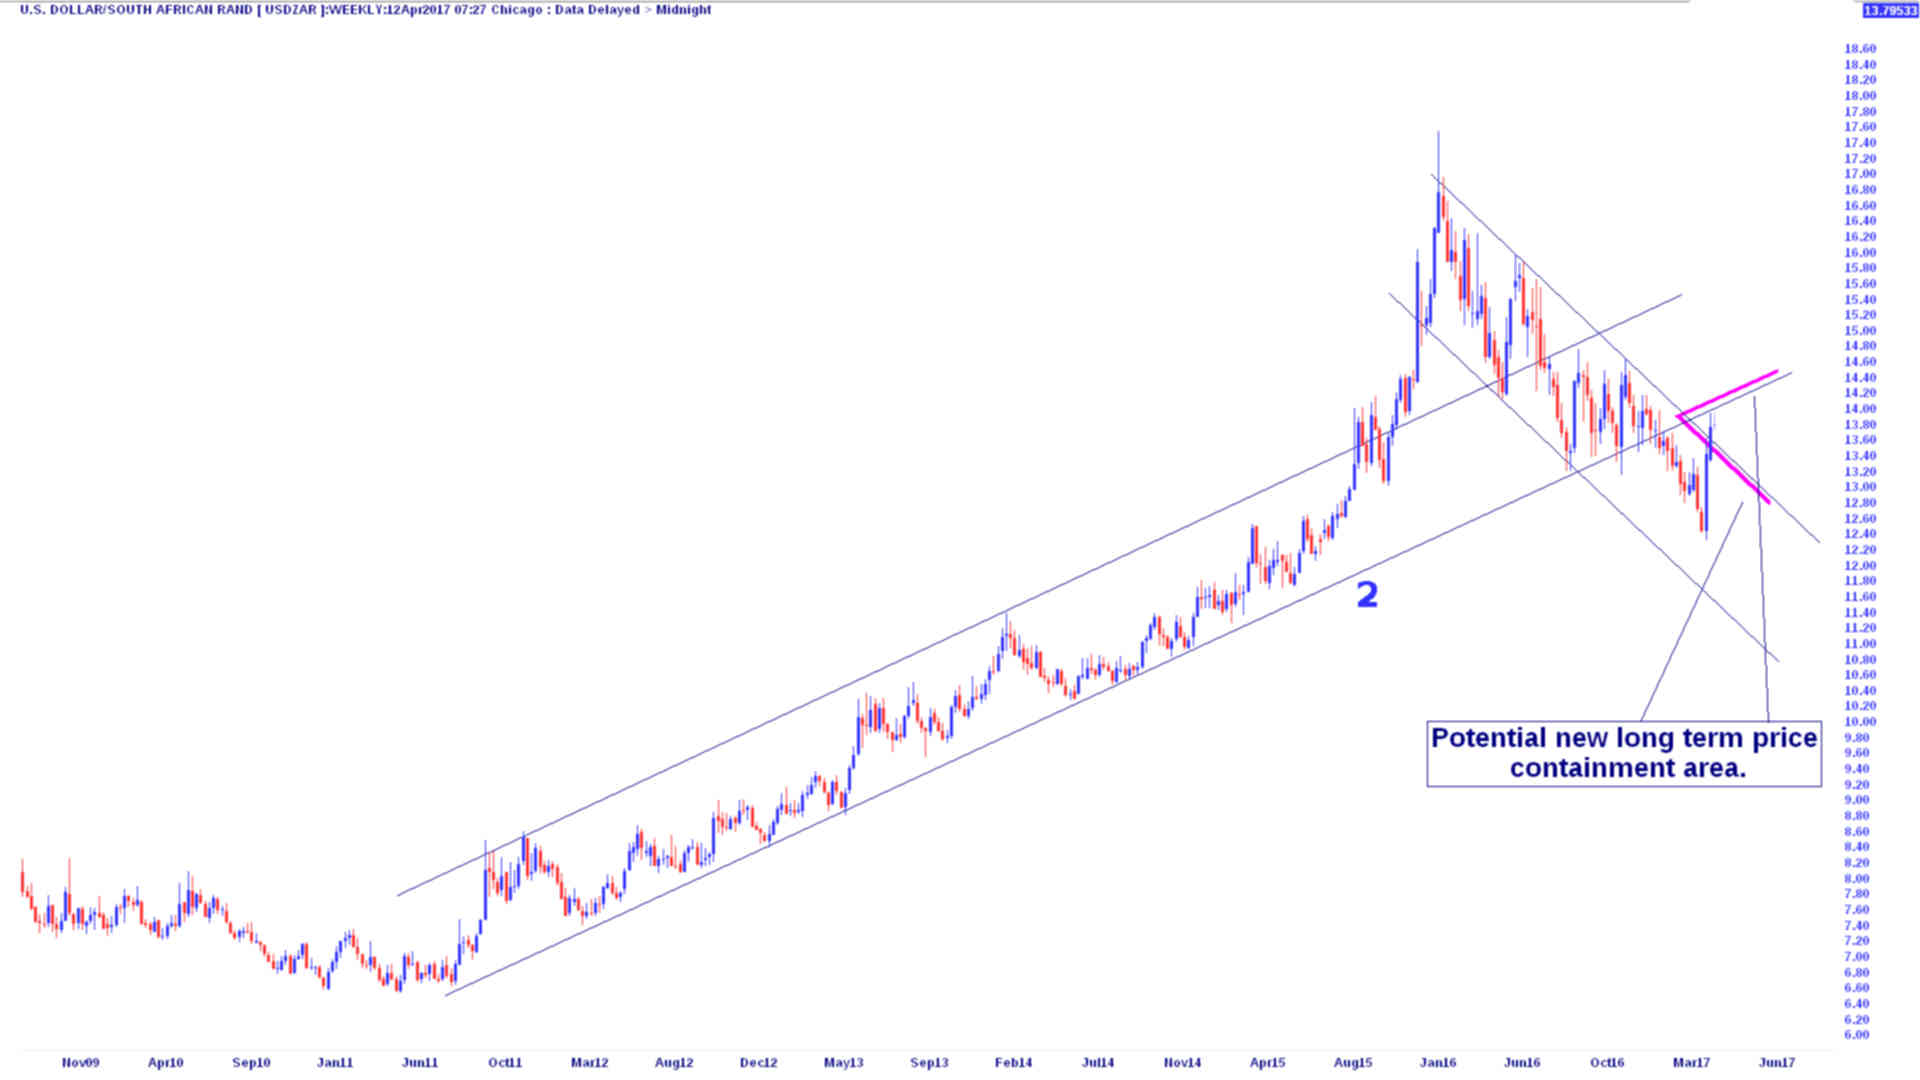
Again we look at a longer term view and see the weekly chart for more clarity of the underlying trend. Here more interesting information presents itself. From July 2011 there was a very defined USD strength trend channel. Around August 2015 the Rand suddenly weakened at an accelerating pace eventually reaching a ZAR low of around R17.50 to the USD. At this point the equilibrium seemed to shift back towards the channel from the Rand being oversold, but it continued forming a new trend with it's new channel of Rand strength. On the bigger, longer term perspective things seem to indicate that the Rand will continue to weaken in line with the previous long term trend. However there is a difference. There is a good chance that the trend will not continue exactly on it's previous trajectory.
If we look at trend line labelled (2) we see that where the price is currently located, near the purple triangle, the suggestion is that, if the trend now continues on the upward USD strength trajectory that was in place from 2011, it might be contained below that trend line labelled (2). This is interesting, it means the Rand might have potential to strengthen against the dollar on the very long term. There will probably be a highly volatile period but the price could be restrained between the purple triangular lines formed by the last two channels intersecting. We also need to look at fundamentals for extra indications. At the moment there is a positive interest differential in selling USD vs the ZAR. This in no doubt has helped the Rand. However there is huge political uncertainty included in South Africa. Again, the Rand is not alone. There is huge political uncertainty in the United States too! Trump is anything but certain.
To conclude, there is a new trend forming. On the long term, the old trends have broken, both the weakening and strengthening one. There will probably be some volatile movements while the price consolidates in line with global uncertainty. Next I will look at the safe havens, such as the Yen and possibly Gold for clues.
19 April 2017
South African Rand versus the Australian Dollar
The graph below is an update to the AUDZAR analysis earlier. It shows where the South African Rand has re-entered the bullish channel with respect to the Australian Dollar.
The weekly graph below also reflects this in the perspective of the longer term trends. Again we are watching for defining moments in whether the price continues in the original direction or starts a new weakening Rand trend.
20 April 2017
Euro versus Great British Pound and the French elections
I found the EURGBP at long term low support. This looks like an excellent medium term trading opportunity. The only problem is the Euro, the proximity of the French elections and the volatility that could bring over this weekend and Monday. For that reason I may wait until Monday appears to make a decision. Then there should be the run off elections two weeks later.
21 April 2017
BTC; The long term view, looking for price drivers and China
I was trying to find drivers for the price of BTC. Reading through articles there seemed to be a worry among the bitcoin crowd who develop the code (developers) that bitcoin could be controlled by parties that control more than 51% of the bitcoin pool. It turns out that this seems to be the case in China, as Chinese bitcoin exchanges seem to control the majority of bitcoin in circulation. Add to this the bitcoin fall early in 2017 seemed to be linked to Chinese authorities requiring controls over the transfer of bitcoin from those exchanges.
Digging deeper it appears that the Chinese authorities might be trying to stem capital outflows. One method of bypassing capital controls is through bitcoin. Another theme popping up is Trumps earlier concerns around Chinese currency controls. So I looked for a correlation between the USD, Chinese Yuan and bitcoin. Sure enough there does appear to be some correlation. The relationship is highlighted with the comparison of the prices of BTCUSD (light blue area) and USDCNY (Dark blue line).
If China decides to let or force the Chinese Yuan to appreciate, this may be the end of the long term price rise in bitcoin as individuals may not want to take their money out of China, thus withdrawing support for bitcoin purchases and seeing that value depreciate. Both the trends remain in a long term bull pattern as long as another higher high is made. Currently there is some divergence in the price between BTC and USDCHN, which may point to a future weakening of bitcoin demand or at least slowing of the momentum of this trend.
I am watching to see if the USDCNY reverses its trend and the Chinese Yuan starts strengthening. If so I will become bearish on the bitcoin. Currently, because the Yuan is still moving upwards, respecting the brown/orange trendline and the bitcoin is also in a bull trend. However I will change my opinion to neutral if the Yuan breaks through the orange trend line. I will probably change to a bearish stance if the bitcoin follows suit and forms a lower low, past the $950 / $900 area.
24 May 2017
USDJPY bearish channel re-entry
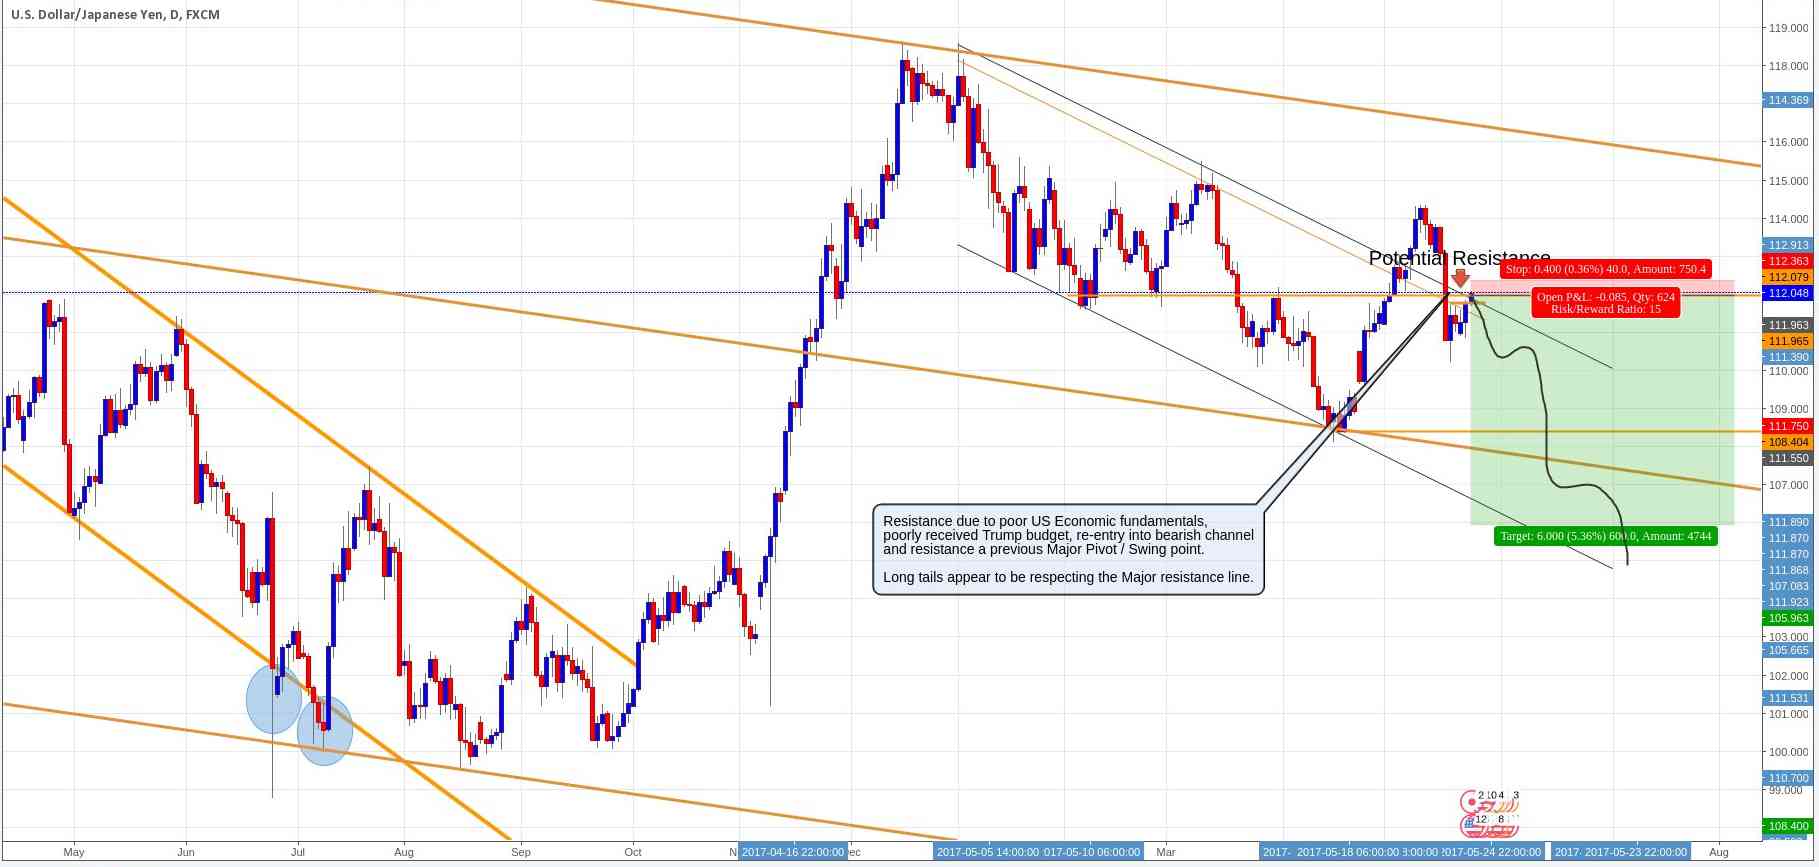
This idea is also related to a 4 hourly chart I have linked below, showing bearish candlestick price action currently active, respecting the major resistance / previous price low / pivot area. Recently President Trump announced his budget, but this was not enough to push the USD above the major inflection point. In fact the pair appears to be taking major resistance below it and the previous bearish channel it has re-entered. Both fundamentals and technicals appear to be giving bearish signals.
If the pair re-enters this bearish channel there might be some major falls to come. I have the entry as 111.968 with 400 ticks Stop loss at 112.368 and take profit of 6000 ticks at 105.968. This yields a risk reward ratio of 15:1. If the price moves 400 or 800 ticks, I would move the stop loss to the entry price. This all depends on the price action or other movements.
If the price moves strongly upwards, then the USD might resume major strength, therefore my Stop is quite small.
To follow the progress of the trade click the link to the live graph here.
Looking at the Rand from a wider perspective
The US Dollar versus the South African Rand
1 January 2020
No more free updates
I am successfully trading independently. I will provide a new independent site for my market analysis.
Check back here to find the link to the new website when it is up and running.
Disclaimer
I am not a financial advisor. I am not qualified in any financial discipline. I am a self employed forex trader sharing his personal journey. Nothing contained in this web site is intended to be interpreted as financial, investment or trading advice in any financial instrument, or class of financial instruments, or to use any particular methods of trading or investing. For financial advice or investment advice seek the services of a qualified financial advisor or similar.
Information contained on this web site is provided for the general information of readers and does not have relevance to any particular person's financial situation, investment objectives or needs. Therefore individuals reading material on this website should not act on the basis of any information in the this website without properly considering its applicability to their own or others financial circumstances. Again, for financial advice or investment advice seek the services of a qualified financial advisor or similar.
Investing and trading involves a very high risk of loss of part or all invested capital. Past and previous results are not indicative of future results.
The decision to invest or trade is for the readers of this website alone. I expressly disclaim all and any liability to any person or enterprise, with respect of anything, and of the consequences of anything, done or omitted to be done by any such person in reliance upon the whole or any part of the information in this website.